We are often told that “knowledge is power.” Well, I for one would say a huge “amen” to that. I remember a pre-internet age in which certain information could be found, if at all, only by going to a library and ploughing through a whole drawer full of index cards. Worse still, until the Freedom of Information Act came along, many public bodies did their best to conceal certain information that we now take for granted. Few local education authorities were keen to publish league tables of public examination results in the 1970s, for fear that they would be used by the “policy capturers” to peddle their favourite hobby-horses, specifically the fortunately unsuccessful campaign to preserve the unsustainable status quo of grammar and secondary modern schools. Today, league tables of exam results are available on any school’s website.
But do we live in an information-rich utopia in which anything that we need to know is available at the click of a mouse? Not quite. One of the most important publicly available datasets is that relating to the commission of criminal offences. 30 years ago, a revolution in crime data took place in New York under the then mayor Rudolph Giuliani[1] and his then police commissioner, Bill Bratton, with the invention of the COMPSTAT (short for “computer statistics”) programme which mapped crime by type, date, time and exact location. Today the majority of police forces around the world use a variant of COMPSTAT, including London’s Metropolitan police.[2]
Crime mapping data has both external and internal customers. A private citizen deciding where to buy a house, or a business deciding where to open a shop, will want to know about the level of crime in specific areas. Police commanders need to know what crimes are happening and where, down to street level, so that they can deploy their officers to crime hotspots to stop crime before it starts. It was this information-enabled pro-activity that led to massive reductions in crime in New York in the 1990s.
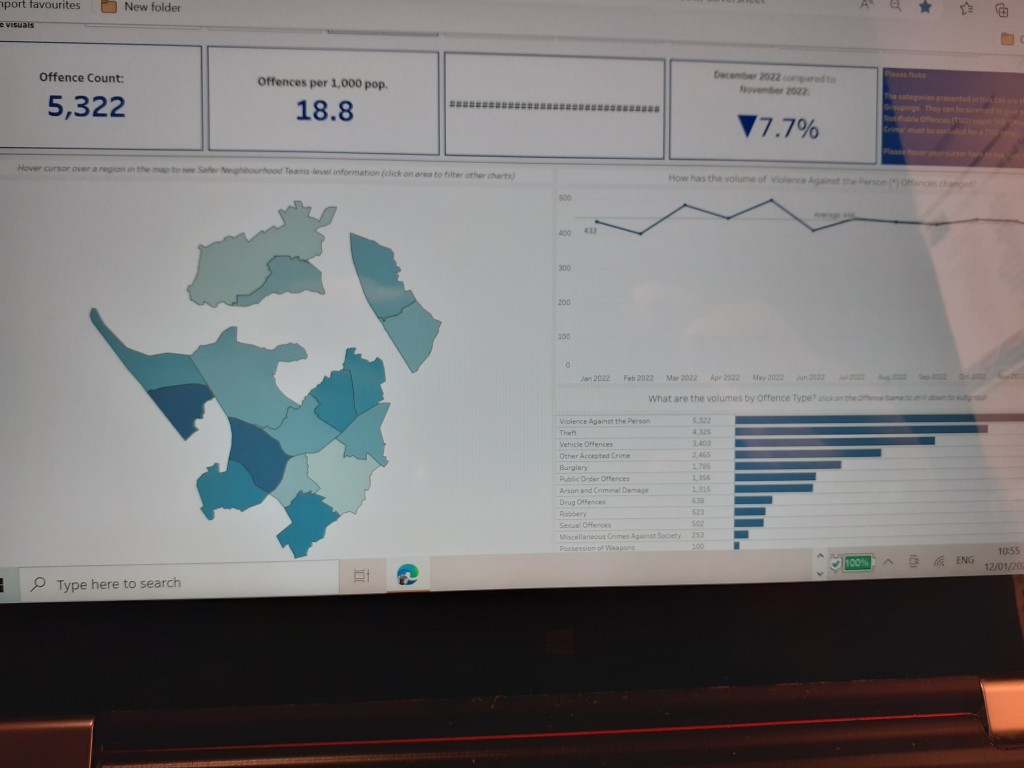
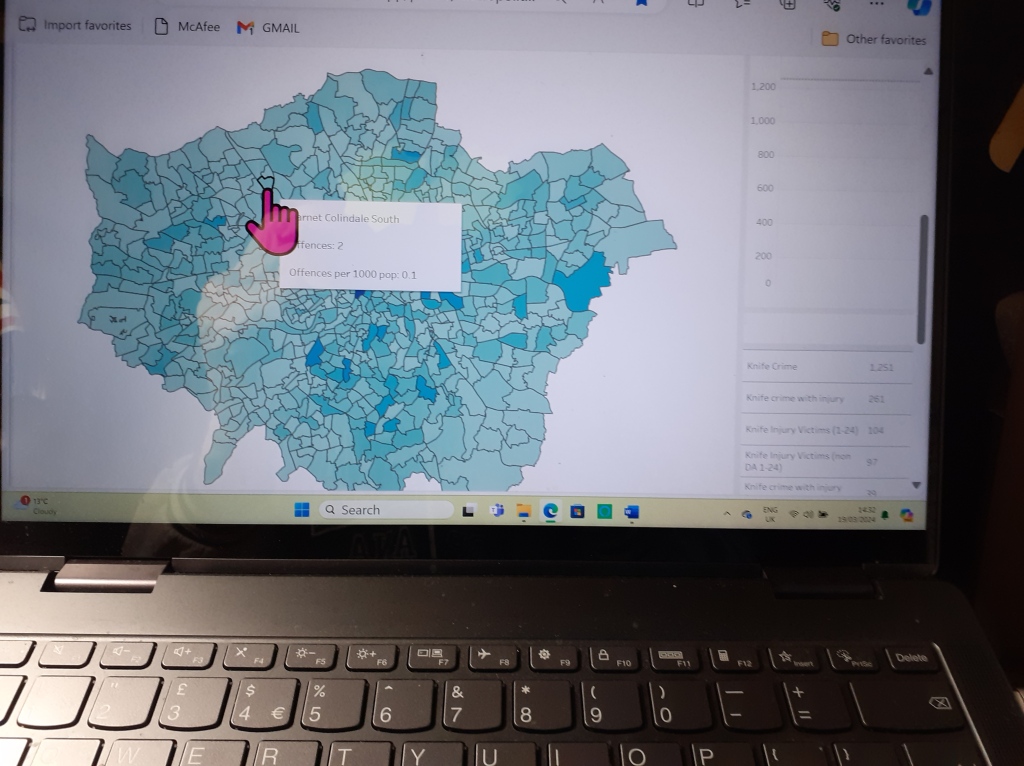
The UK in general, and London in particular, is in the grip of a serious crime wave. One of the key solutions to this is “accurate and timely intelligence,” to use a phrase coined by the late Jack Maple, a deputy police commissioner in New York in the Giuliani years.[3] It enables the police to work to the same schedules, and in the same places, as the crooks, thus preventing crime even before it has happened. Sadly, the information displayed on the Metropolitan police’s crime mapping website cannot fairly be described as “timely.” As I write this blog, we are at the beginning of April, yet the latest crime figures on this website are those for January. Neither Bill Bratton nor Jack Maple would have tolerated this; they demanded that crime be mapped daily. Worse still, the Met’s website lacks user-friendliness. If you want to know about, say, knife crime in a particular borough, you just click on a link to “KNIFE CRIME” then click on a map of London’s 32 boroughs and select the one that you want. The problem arises when you want to drill down to specific parts of the borough. For policing purposes each borough is divided into Safer Neighbourhood Teams (SNTs). When you click on the borough icon, you expect to find a further breakdown of a particular crime by SNT area. Sadly, you find that data for whole chunks of the borough is missing. I include a screenshot of the borough of Barnet to show this deficiency. What do you do if you want to find out how many knife crimes happened in January 2024 in, say, the Colindale North SNT area, which is one of the missing areas from the screenshot? You have to go into a London-wide map of all the SNTs, locate the one that you want and hover your mouse over it. It’s probably due to a simple glitch, caused by different parts of the programme not being linked to each other, but it needs to be corrected urgently.
The bottom line is that the Metropolitan police’s crime mapping website has some way to go before it matches the standards of those in use by US police forces. I could go on forever about other deficiencies, such as the way in which the user must play around with the “zoom” on the computer to get the right view of the information that he/she requires, but for the sake of brevity, I will desist.
Having handed out some demerit points, I must hand out generous helpings of praise for a management information system used in the world of education, specifically in schools run by the Community Schools Trust (CST). It is called Dynamic Progress Reporting (DPR).[4] It is an all-embracing management information system that enables teachers, parents and pupils to see at a glance how pupils are performing against specific assessment criteria that are linked to the school curriculum, which is determined by the requirements of examination boards. The advantages are overwhelming. Homework can be live-marked; no longer do teachers have to carry home mountains of exercise books to mark after a hard day’s work. Parents can see, without having to wait for a parents’ evening or an end-of-term report, what knowledge their son or daughter is being taught, and at what level he/she is performing with regard to specific skills that must be evidenced in order to pass an examination at GCSE level. Pupils can see what, specifically, they are expected to learn and have their homework assessed for evidence of competence in required areas.
I dearly wish my own school had had DPR in the 1970s. it would have been helpful for me to have been told, say, that in mathematics I needed to practise solving quadratic equations, or using the sine and cosine functions to solve a trigonometric problem. Instead I just received an end-of-term report from my teacher that condemned my work as “consistently appalling,” Whilst I’ll admit that my mathematical abilities back then were seriously deficient, broad-brush judgements of this nature were not helpful.
We live in an irrevocably digitised age, in which competence at using computers is just as essential a life skill as was using a quill pen in the 18th century. The important decisions that we all make, in a personal or professional capacity, are now, and will in future be, data-driven. It’s a cliché, but a true one, that the best decisions are the best-informed decisions. This is why accuracy, timeliness, completeness and presentational user-friendliness of electronic data are all-important. Designers of IT platforms need to bear this in mind. Whilst a minimum level of computer literacy must be assumed in everyone in the 21st century, not everyone can be a Ph.D.-level computer scientist. Getting that balance right is the key to successful exploitation of digital data.
[1] For more information read Giuliani’s book Leadership: Amazon.co.uk: Rudolph W. Giuliani, Ken Kurson: 9780786868414: Books
[2] See Stats and data | Metropolitan Police
[3] Jack Maple’s book The Crime Fighter: How You Can Make Your Community Crime Free: Amazon.co.uk: Maple, Jack, Mitchell, Chris: 9780767905541: Books is a must-read on this subject. It inspired the early 2000s police drama THE DISTRICT.
[4] An excellent video on the mechanics of Dynamic Progress Reporting is here : What is Dynamic Progress Reporting (DPR)? (youtube.com)
